 Animals
 Animation
 Art of Playing Cards
 Drugs
Drugs Education
 Environment
 Flying
 History
 Humour
 Immigration
 Info/Tech
 Intellectual/Entertaining
 Lifestyles
 Men
Men Money/Politics/Law
 New Jersey
 Odds and Oddities
 Older & Under
 Photography
 Prisons
 Relationships
 Science
 Social/Cultural
 Terrorism
 Wellington
 Working
 Zero Return Investment
The Odds of Dying
Tornado Season UnderwayWeather forecast for tonight: dark. - George Carlin
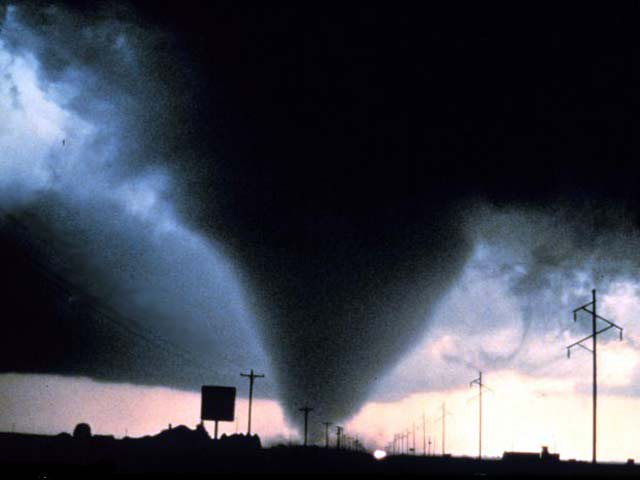
Tornado captured during NOAA Project Vortex. The photo was taken south of Dimmit, Texas June 1995. by Michael Schirber [Excerpt] Tornado AlleyTornadoes can occur almost anywhere in the world, but the United States is the country with the highest frequency of tornadoes. Each year there are about 1,200 tornadoes in the US, causing about 65 fatalities and 1,500 injuries nationwide. Twisters strike predominantly along Tornado Alley - a flat stretch of land from west Texas to North Dakota. The region is ideal for tornadoes, as dry polar air from Canada meets warm moist tropical air from the Gulf of Mexico. Texas gets hit the most, with an average of about 110 tornadoes a year. But every state in the union has recorded at least one tornado in its past (although they are extremely rare in Alaska). In fact, Florida has the most tornadoes per area, but they are typically weaker. In southern states like Arkansas and Missouri, the peak of tornado season is March through May, while in the northern states, like Iowa and Illinois, more tornadoes occur in the late spring and summer. F-scaleIn the early 1970s, T Theodore Fujita developed a damage scale for high-wind events including tornadoes. The F-scale, which goes from F0 to F5, is the only widely used tornado rating method. Although wind speeds are given for different F-scale ratings, these are only estimates, as it is very hard to get reliable measurements near a twister. Violent tornadoes - F4 and above - are less than 1% of all tornadoes, but account for 70% of tornado-related deaths. Some of these twisters can last more than an hour and travel hundreds of miles. Almost 90% of tornadoes are weak - F0 or F1 - lasting usually less than 10 minutes and causing less than 5% of tornado-related deaths. The F-Scale Wind Typical Damage
Source: www.livescience.com 22 March 2005
The Odds of Dyingby Robert Roy Britt According to the National Center for Health Statistics, the leading causes of death in the US are, in this order, cancer, heart disease, stroke, chronic lower respiratory diseases, and "accidental injury," a broad category that includes a lot of stuff that just happens. You are more likely to commit suicide or fall to your death than be killed by a tsunami or any natural disaster, the odds say. Overall, global deaths from sudden natural disasters - things Nature dishes out over moments, hours or days - have been on the decline in recent years, with the exception of 2003 and 2004. Officials credit better warnings and swifter response to help victims. In 2003, the last year for which worldwide deaths have been tabulated by the Red Cross, natural disasters killed 76,000 people. The figure was skewed by two events: a heat wave in Europe that overcame more than 22,000 and an earthquake in Iran that killed upwards of 30,000. (Earthquakes kill roughly 10,000 people every year, on average.) The previous 10 years - excluding the tsunami at the end of 2004 - saw an average of 62,000 global deaths per year from natural disasters. That's far less than the tolls taken by famine, disease and war. Communicable diseases kill millions of people every year (13.3 million 1998, according to the World Health Organization). In sub-Saharan Africa last year, AIDS killed about two million people, according to a recent article in the Wall Street Journal. Even more died because of bad water or sanitation systems. In Kenya, AIDS deaths are "equivalent to two 747 jets crashing every day," stated a recent Red Cross report. Another study estimated that 3.3 million people died due to war in the Democratic Republic of the Congo from 1998 to 2002. More than three-quarters of the deaths owed to diseases and malnutrition resulting from the fighting. Globally, violence is a leading killer. It accounts for 14% of all deaths among males and 7% among females, according to a 2003 analysis by the World Heath Organization. On an average day, 1,424 people are murdered. Somebody commits suicide every 40 seconds. Perceptions of risk factors can change over time simply because more is learned. The chances of an Earth-impacting asteroid killing you have dropped dramatically, for example, from about 1-in-20,000 in 1994 to something like 1-in-200,000 or 1-in-500,000 today. The new numbers - their range reflecting the need for further research - were offered up last week by Clark Chapman of the Southwest Research Institute and David Morrison at NASA's Ames Research Center. All figures below are for US residents. Cause of Death Lifetime Odds
Source: www.livescience.com 5 January 2005
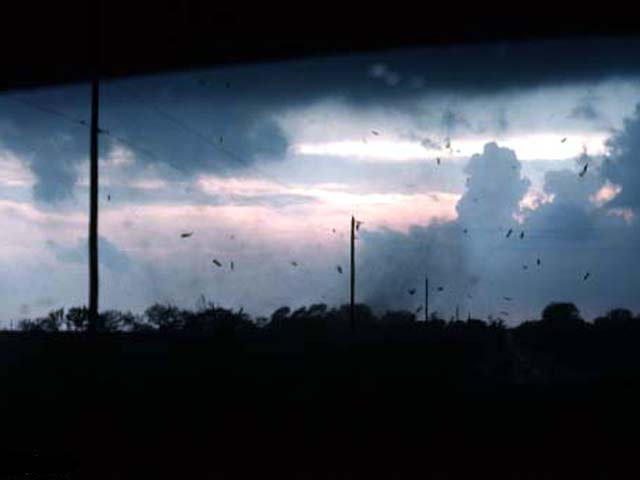
Right in the Middle...
El Reno Oklahoma, 30 April 1978, looking W. This photo was shot from the back of a storm intercept vehicle Also see:
For pages on natural disasters - including the above-mentioned lightning strikes, volcanoes and hurricanes but also global warming and more - as well as satellite photos and
some great pictures of trees, clicking the "Up" button immediately below takes you to the Table of Contents page for this Environment section. |