Animals
 Animation
 Art of Playing Cards
 Drugs
Drugs Education
 Environment
 Flying
 History
 Humour
 Immigration
 Info/Tech
 Intellectual/Entertaining
 Lifestyles
 Men
Men Money/Politics/Law
 New Jersey
 Odds and Oddities
 Older & Under
 Photography
 Prisons
 Relationships
 Science
 Social/Cultural
 Terrorism
 Wellington
 Working
 Zero Return Investment
Measuring Up
100% of Kiwis Are Above AverageThe best argument against democracy is a five-minute conversation with the average voter. - Sir Winston Churchill The average person thinks he isn't. - Father Larry Lorenzoni The stats below aren't current, but I expect they're still representative. The average hourly wage in New Zealand in 2005 was NZ$19.30, up more than 23% from the year 2000 (but that's not adjusted for inflation because I'm too lazy to do that). By 2015, there are projected to be 4.4 million people (as of 31 March 2007, there were 4,177,000, so slow growth). Almost 45% more people were enrolled in tertiary education in 2004 than in 1999, which will have a major impact of some sort. Kiwi males live longer than either Yanks or Ozzies, though Kiwi women don't outlive Ozzie women (yet). Kiwis tend to be slightly younger than Ozzies and to have a lower GDP per capita (but higher IQ, no doubt). Source: stats.govt.nz 2007
From: NZ Qualifications Authority, Mensa, Land Transport Safety Authority, Smokefree Coalition, Salvation Army, Family Planning Association, Department of Health, Department of Statistics, Recording Industry Association of New Zealand, Hillary Commission, NZ on Air, NZPA, IRD, Alcohol Advisory Council of New Zealand, New Zealand Post, Video Association of New Zealand, New Zealand Video Dealers Association, MVDI, Automobile Association, Coca-Cola Amatil NZ, Poultry Industry Association, Department of Courts, Masport, McDonald's NZ, Sanitarium Health Food Company Equine Health Association, REINZ, Magazine Publishers Association, Cadbury Confectionery Source: The Evening Post Wednesday 29 September 1999
Average GamblerThe difference between a lottery and other forms of gambling is that no one has any ability whatsoever to influence the outcome by any knowledge, experience or skill they possess. - Lesley Meadows Did You Know?
A coin is tossed to decide which of two sets of Lotto balls will be used each week. Lotto balls are made in France. They're washed in a silicon solution every 8 weeks and weighed with government scrutineers watching to check for any changes which could interfere with a random draw. Source: The Dominion Tuesday 10 August 1999
Gaming Expenditure Statistics ReleasedGaming expenditure statistics released today by the Department of Internal Affairs show that the amount spent on the four main sets of gaming activities for the 1999/2000 year totalled $1.3 billion, an 11% increase over the previous year. The key points in the 2000 expenditure figures are:
During the 2000 year two new casinos opened, one in Queenstown and the other in Dunedin. As at 31 December 2000, non-casino gaming machine licensing statistics indicated that:
Under the Gaming and Lotteries Act 1977, a licence to operate gaming machines must be issued to any applicant organisation that can show that it is established and conducted entirely for non-commercial purposes, whose intent is to raise funds for community purposes and that meets relevant policy criteria. The Gaming Review, announced in June 2000, will consider issues relating to the appropriate regulatory regime for all forms of gaming. The Review considers the changing rates of participation in some forms of gaming and the flow-on effects of these changes on, for example, community funding and problem gambling. The Department of Internal Affairs is also currently overseeing the New Zealand Gaming Survey, a comprehensive and significant body of work on the issue of problem gambling that will inform the Gaming Review. A Gaming Review consultation paper seeking views on all these issues will soon be available. The consultation paper will provide an appropriate forum for issues raised by the release of these statistics. In releasing the 2000 Gaming expenditure statistics, the Department of Internal Affairs cautions readers not to confuse the terms turnover and expenditure (ie monies spent). Turnover does not represent the amount "spent" because much of the amount "turned over" is actually given back to players in prize money, particularly in relation to gaming machines, casinos, and race betting. For example, if a player has $20 to spend on a gaming machine and plays until the full $20 is lost it is likely that this $20 will be recorded on the machine's meters as $120 or more of turnover. The gaming expenditure statistics are available on the Department of Internal Affairs' gaming licensing website, www.gaminglicensing.dia.govt.nz. Statistical information about non-casino gaming machines is also available on the website. The latter information is updated on a quarterly basis.
The Compulsive Gambling Society claims that these figures show New Zealand is saturated with gambling options and that there will be heavy costs to pay in the future. The society's chairperson, Peter Adams, said he believes addiction to gaming machines, or pokies, is widespread, particularly among those from lower socio-economic backgrounds. Dr Adams said that an independent commission of gambling should be set up as the Department of Internal Affairs serves the industry, rather than those adversely affected by gambling. Source: www.newsroom.co.nz 31 January 2001
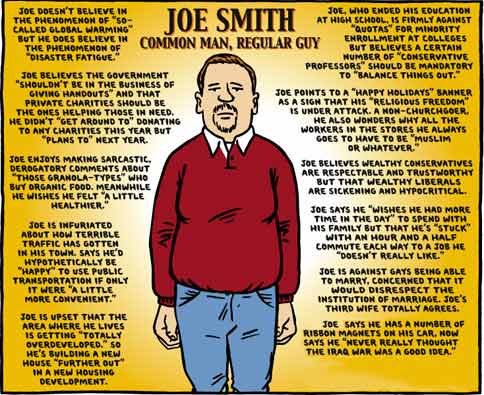
by Ward Sutton suttonimpactstudio.com
Average HealthHealth Report Says We're Too Fat and Smoke Too Much DopeA report card on New Zealand's health progress paints a picture of an unwholesome nation that's too fat, smokes too much cannabis and spends too much time in the sun. New Zealand has been tracking away from its health targets for obesity, cannabis consumption, alcohol-related illness and melanoma, according to the Government report, Progress on Health Outcome Targets 1999. It is also off-target for bringing down rates of youth suicide among women, HIV, breast cancer and diabetes. But the report is not all bad. High points include reductions in overall tobacco consumption (though lung cancer deaths for women are up), injuries and deaths from road crashes, and deaths from stroke, cot death and heart disease. Health director-general Karen Poutasi believed people's attitudes towards healthy lifestyles were changing for the better. "Now it is a matter of encouraging people on how to make the changes that will make a difference." The New Zealand Health Strategy - a framework for district health boards and the Health Ministry made public last week - would focus on the problem areas of nutrition, obesity, tobacco and drug use, she said. Health Minister Annette King said New Zealand badly needed to turn around obesity rates. The report shows the number of obese men has increased from 10% in 1989 - 1990 to 15% in 1997, and the percentage of women from 13 to 19% in the same period. A further breakdown of the statistics for women shows that Pacific people have the highest proportion of obesity at 47%, and 28% of Maori women suffer from obesity. Findings in the report include:
It is the Government's seventh annual report measuring progress against health targets, drawing on information from the Health Information Service, the national cancer registry, Statistics New Zealand, the Land Transport Safety Authority, the National Audiology Centre and non-government organisations. Source: The Dominion Tuesday 19 December 2000
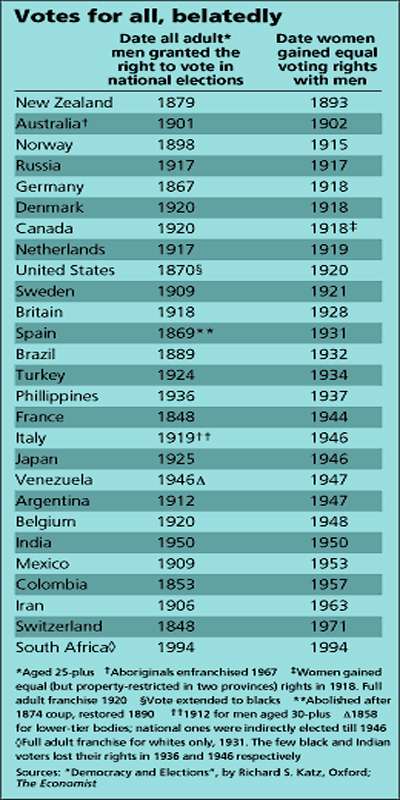
Leading the Rest
Source: The Economist date undenoted
For satellite photos and pictures of Wellington from several different angles and for articles about earthquakes, history, business, the Ohariu Valley, statistics,
fireworks, the national anthem, the kiwi icon and more click the "Up" button below to take you to the Table of Contents for this Wellington section. |